A resilient market driving sustainable economic recovery
Explore the key performance metrics of the Colombo Stock Exchange (CSE) over recent years and months, highlighting vital trends in turnover, share volume, market indices, and returns. This data provides a comprehensive snapshot of the market's growth trajectory and its evolving dynamics.
| Market Highlights | 2026 | 2025 | 2024 | 2023 | 2022 | 2021 | 2020 |
|---|---|---|---|---|---|---|---|
| Total Turnover ($ Mn) | 14798.91 | 4,088.45 | 1,743.96 | 1,195.37 | 2,436.73 | 6,081.30 | 2,158.03 |
| Daily Average Turnover ($ Mn) | 15.40 | 17.18 | 7.27 | 4.94 | 10.55 | 25.34 | 10.32 |
| Turnover Velocity (%) | 14.50% | 18.06% | 10.81% | 10.06% | 15.28% | 27.77% | 15.69% |
| Share Volume (Mn) | 19.11 | 46.65 | 23.25 | 16.99 | 29.05 | 59.77 | 21.35 |
| No. of Trades (No.'000) | 3573.68 | 7,493.00 | 3,524.07 | 3,618.96 | 6,057.23 | 8,131.51 | 3,070.02 |
| Market Capitalization ($ Bn) | 25.50 | 26.76 | 18.47 | 12.37 | 13.65 | 28.45 | 16.09 |
As @ 30th May 2026
The CSEALL is a market capitalization-weighted index where a company's weight is based on the number of ordinary shares listed. Larger companies have a greater impact on the index, reflecting the assumption that they are more influenced by the general economic situation.
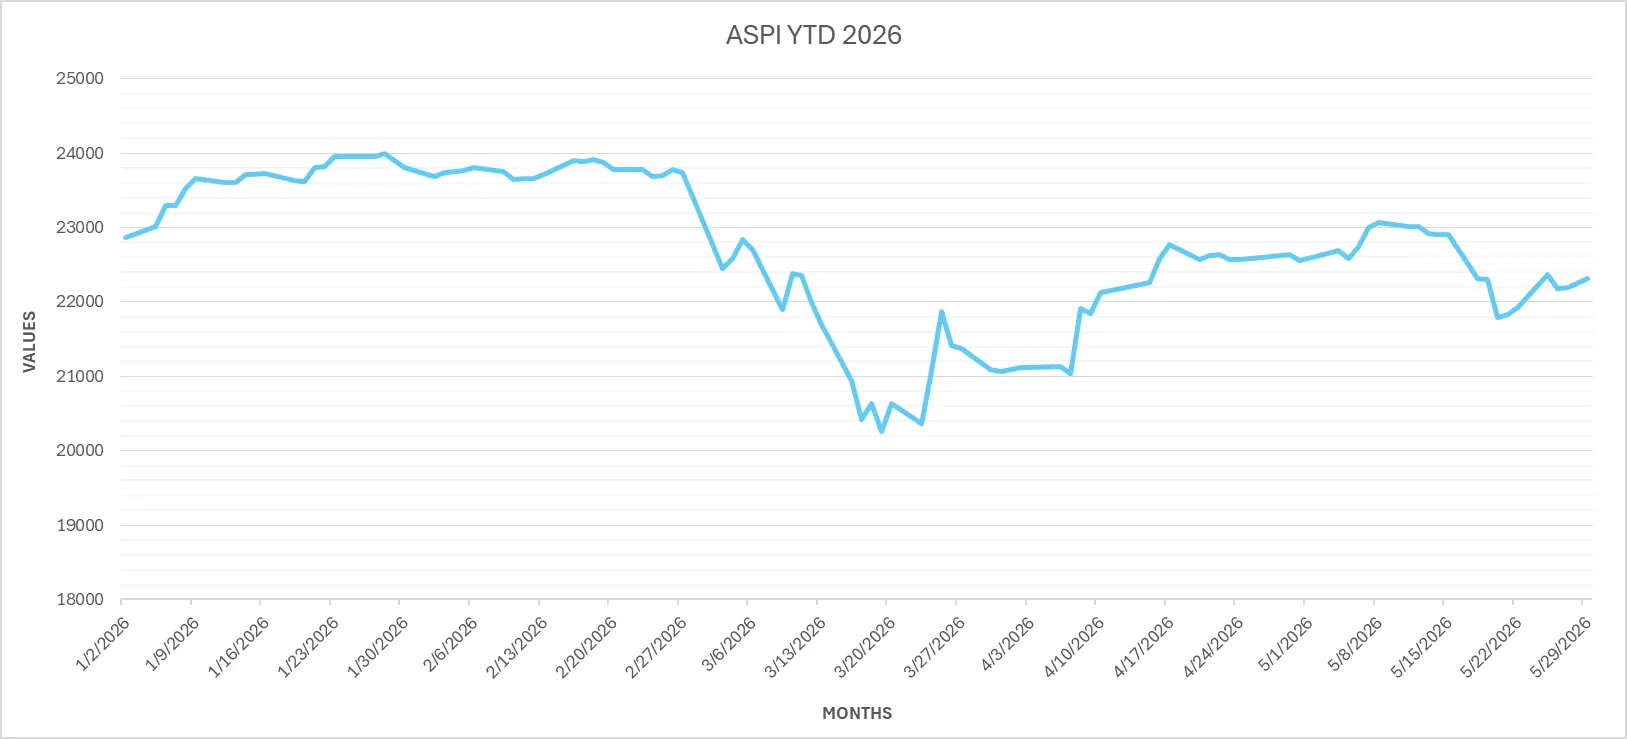
The line chart below illustrates the performance of the All Share Price Index (ASPI) over the last five months.
The S&P SL 20 tracks the largest, most liquid blue-chip companies on the Sri Lankan stock market, following the methodology of Standard & Poor's to ensure consistency, transparency, and liquidity. It serves as a basis for tradable products, including index funds and exchange-traded funds (ETFs), with strict inclusion criteria for size, liquidity, and financial viability.
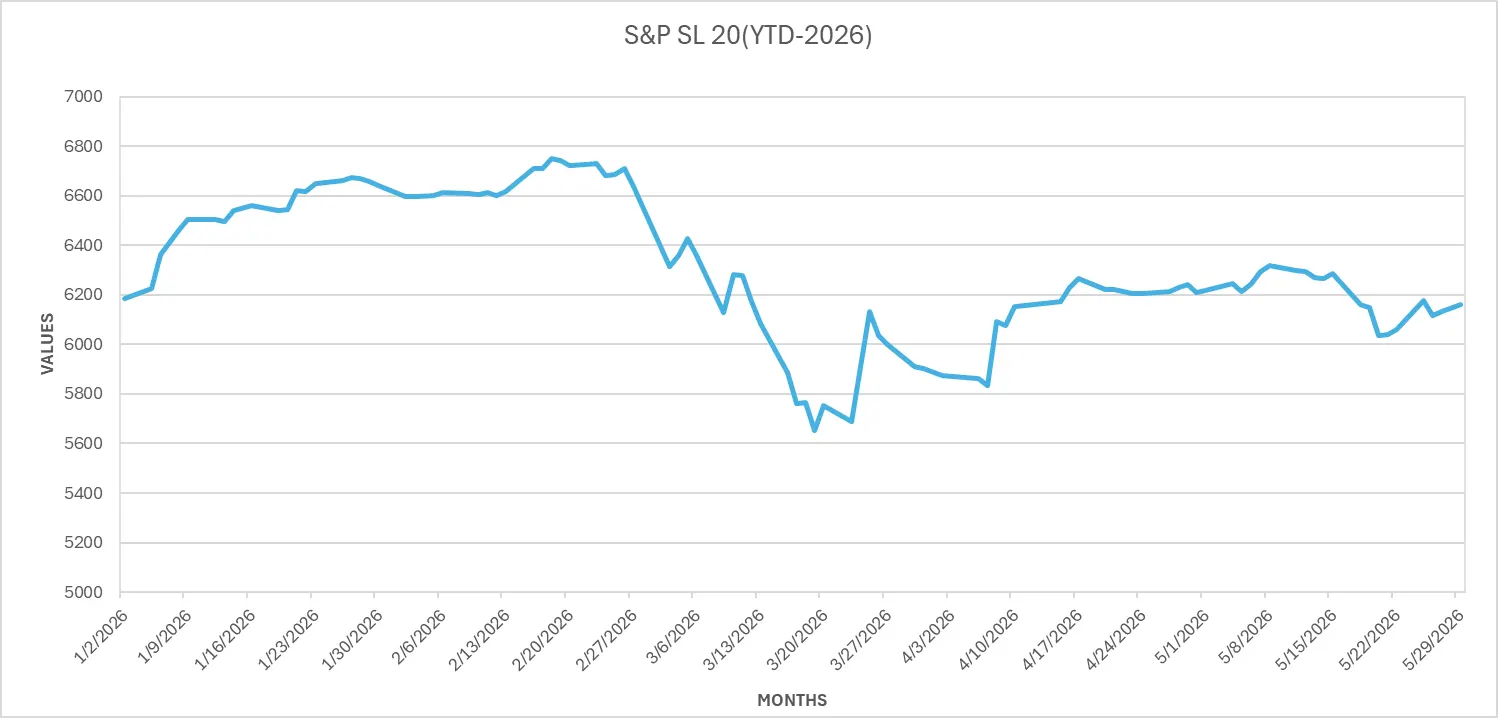
The line chart below illustrates the performance of the S&P SL20 Index over the last five months.